The Anniversary Nobody Is Celebrating
Exactly one year ago today, President Trump signed executive orders imposing a universal 10 percent tariff on all imports and differential "reciprocal" tariffs on major trading partners — with rates reaching as high as 50 percent on some countries. Dubbed "Liberation Day," the action pushed the U.S. average effective tariff rate to roughly 22.5 percent, its highest level since the Smoot-Hawley era of the early 1930s.
Twelve months later, the tariff landscape has been reshaped by legal challenges, partial rollbacks, and a handful of bilateral deals. But the economic footprint remains substantial. According to the Yale Budget Lab, the current effective tariff rate sits at approximately 17.5 percent — still five times pre-2025 levels — and the cumulative cost to the average American household runs to roughly $1,700 per year in higher prices.
At Archimedes Research Group, we track over 80 macroeconomic series through our FRED-anchored data pipeline. What those indicators tell us one year into the tariff experiment is worth examining in detail.
The Inflation Pass-Through Is Real
The administration's initial argument was straightforward: tariffs would bring manufacturing home, and new domestic production would eventually lower consumer prices. The data has not cooperated with that narrative.
Federal Reserve Chair Jerome Powell has attributed between half a percentage point and three-quarters of a percentage point of the current inflation rate directly to tariff effects. Research from the Harvard Pricing Lab found that tariff pass-through to retail prices reached 24 percent through October 2025, contributing a cumulative 0.76 percentage points to the Consumer Price Index. New York Fed data showed that Americans bore 94 percent of the tariff cost in August 2025, with consumer pass-through reaching 76 to 100 percent by year-end.
The CPI sub-indices in our dataset tell the story at a granular level. Food prices climbed 2.8 percent from tariff actions alone, with sugar and sweets up 5.7 percent year-on-year through January 2026. Apparel and leather goods — categories with among the highest effective tariff rates — saw short-run price increases of 21 and 23 percent, respectively, according to Yale Budget Lab modeling. Our CPI components series (CPIUFDSL, CPIAPPSL, and the broader CPIAUCSL) all reflect this upward pressure, with core services inflation proving especially persistent through the first quarter of 2026.
The Labor Market: Quiet Deterioration
Perhaps more consequential than the price data is what is happening beneath the surface of the labor market. The February 2026 JOLTS release showed job openings falling to 6.88 million — below market expectations and hovering near five-year lows. While the headline is not alarming in isolation, the trajectory tells a different story. Openings rebounded to 6.95 million in January from a trough of 6.55 million in December 2025, but the February decline suggests that bounce was likely noise rather than a durable recovery in labor demand.
Hires fell to 4.8 million in February, while total separations held at 5.0 million. Quits — the so-called "take this job and shove it" indicator of worker confidence — were little changed at 3.0 million, well below the 4.0 million-plus levels of 2022. In our data pipeline, initial claims (ICSA) have been trending higher, and payroll growth (PAYEMS) on a 3-month annualized basis has decelerated meaningfully from mid-2025 levels.
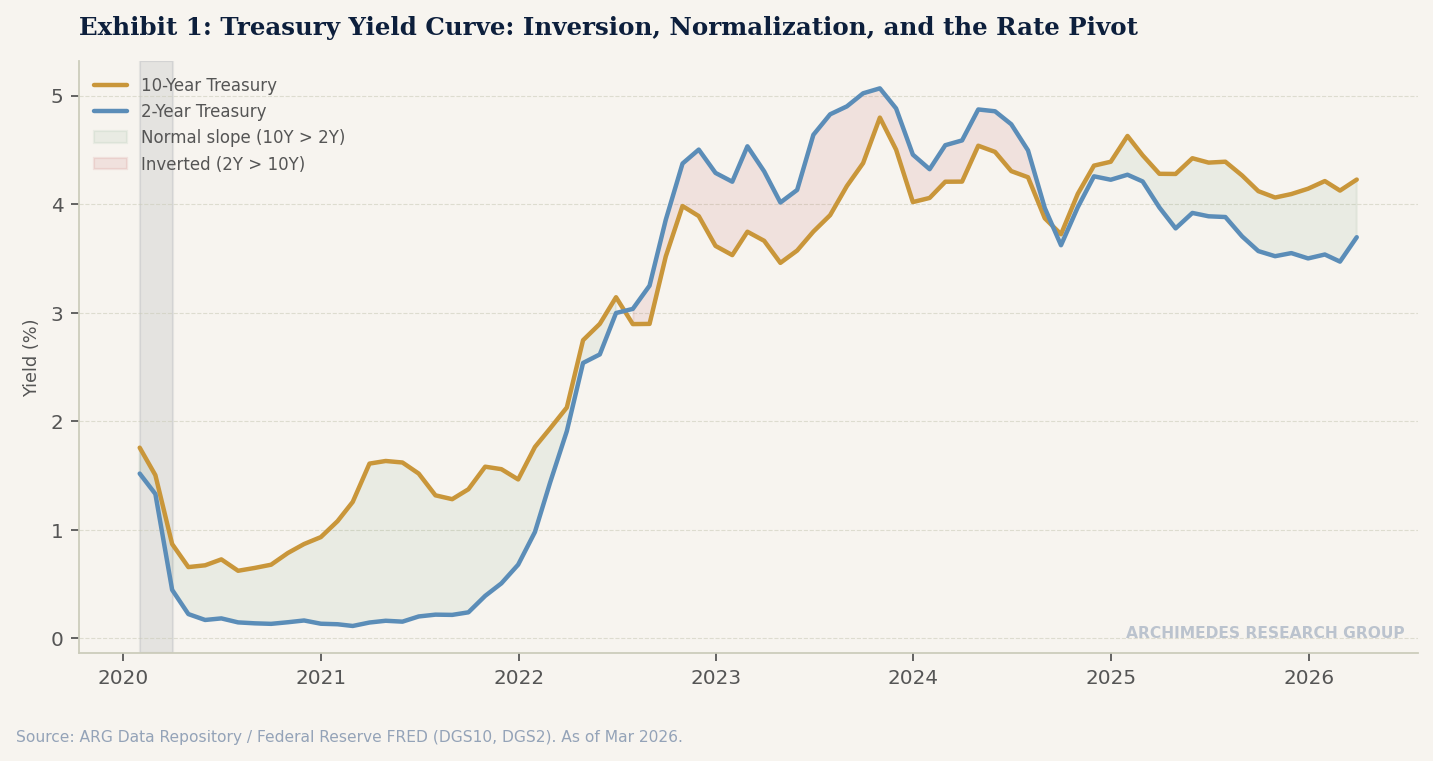
This matters because the labor market has historically been the last domino to fall before a recession. The yield curve (T10Y3M in our dataset), which inverted in 2023 and remained inverted through much of 2024, has normalized to a positive 0.51 spread as of early 2026. The New York Fed's recession probability model, which uses this spread, currently assigns a 25 percent probability of recession by November 2026. That is not a panic signal, but it is notably elevated by historical standards — and it does not yet fully incorporate the labor market softening we are seeing in the JOLTS data.
Trade Deficits, Agricultural Carnage, and the Reshoring Mirage
The tariffs were supposed to shrink the trade deficit and catalyze a manufacturing renaissance. Neither has materialized in the data.
Over the course of 2025, U.S. goods imports actually rose to $3.4 trillion — up 4 percent from 2024. Exports grew faster at 6 percent, reaching $2.2 trillion, but the total goods trade deficit still expanded by roughly 2 percent to $1.24 trillion. GDP growth was revised down to a 0.7 percent annualized rate, and J.P. Morgan's current 2026 forecast sits at a modest 1.8 percent, with the OECD even lower at 1.5 percent.
The agricultural sector has borne a disproportionate share of the pain from retaliatory tariffs. U.S. soybean exports to China collapsed 78 percent through August 2025. Corn exports to China fell 99 percent. Total agricultural exports to China are projected to halve from $17 billion in 2025 to $9 billion in 2026. These are not rounding errors — they represent entire supply chains being rerouted away from American producers.
On the reshoring front, the gap between rhetoric and reality is stark. While 63 percent of U.S. business executives reported considering reshoring, only 10 percent were actually taking action, and 64 percent reported no reshoring plans at all. Manufacturing construction spending declined from $230.9 billion in January 2025 to $196.2 billion in January 2026. The factories, it turns out, are not roaring back.
The Deals Scorecard
The administration completed 17 bilateral trade deals out of a promised "90 in 90 days." All were concluded before the Supreme Court's February 2026 ruling struck down the use of IEEPA to impose tariffs — a decision that removed the administration's primary leverage tool and triggered a complex refund process for roughly $166 billion in tariffs deemed wrongly collected.
The deals that were struck yielded large headline investment pledges: $550 billion from Japan, $350 billion from South Korea, and $70 billion from Malaysia among others. But as the Council on Foreign Relations has noted, the structural problems are significant. Partners made new commitments while the U.S. maintained barriers higher than pre-2025 levels. The agreements are frameworks rather than binding treaties, and they bypassed congressional oversight entirely, making them vulnerable to reversal by any future administration.
What We Are Watching
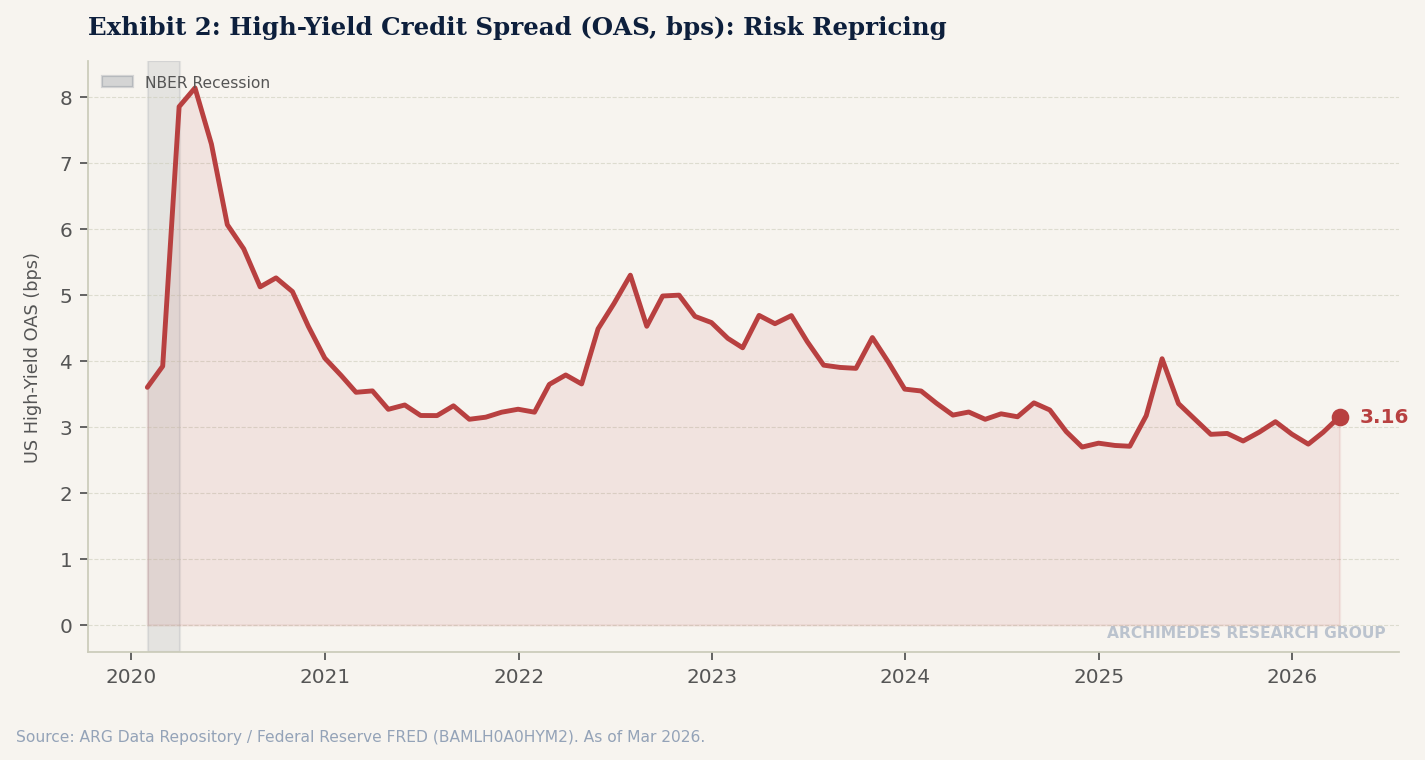
From our data pipeline, the indicators we are monitoring most closely in the months ahead are the financial stress indices. The St. Louis Fed Financial Stress Index (STLFSI4), the Chicago Fed National Financial Conditions Index (NFCI), and the high-yield OAS spread (BAMLH0A0HYM2) will tell us whether the trade policy uncertainty is beginning to tighten financial conditions in a way that amplifies the labor market softening. Credit delinquency rates (DRCCLACBS, CORCCACBS) and the debt service ratio (TDSP) are also worth watching as households absorb higher prices with less labor market cushion than they had a year ago.
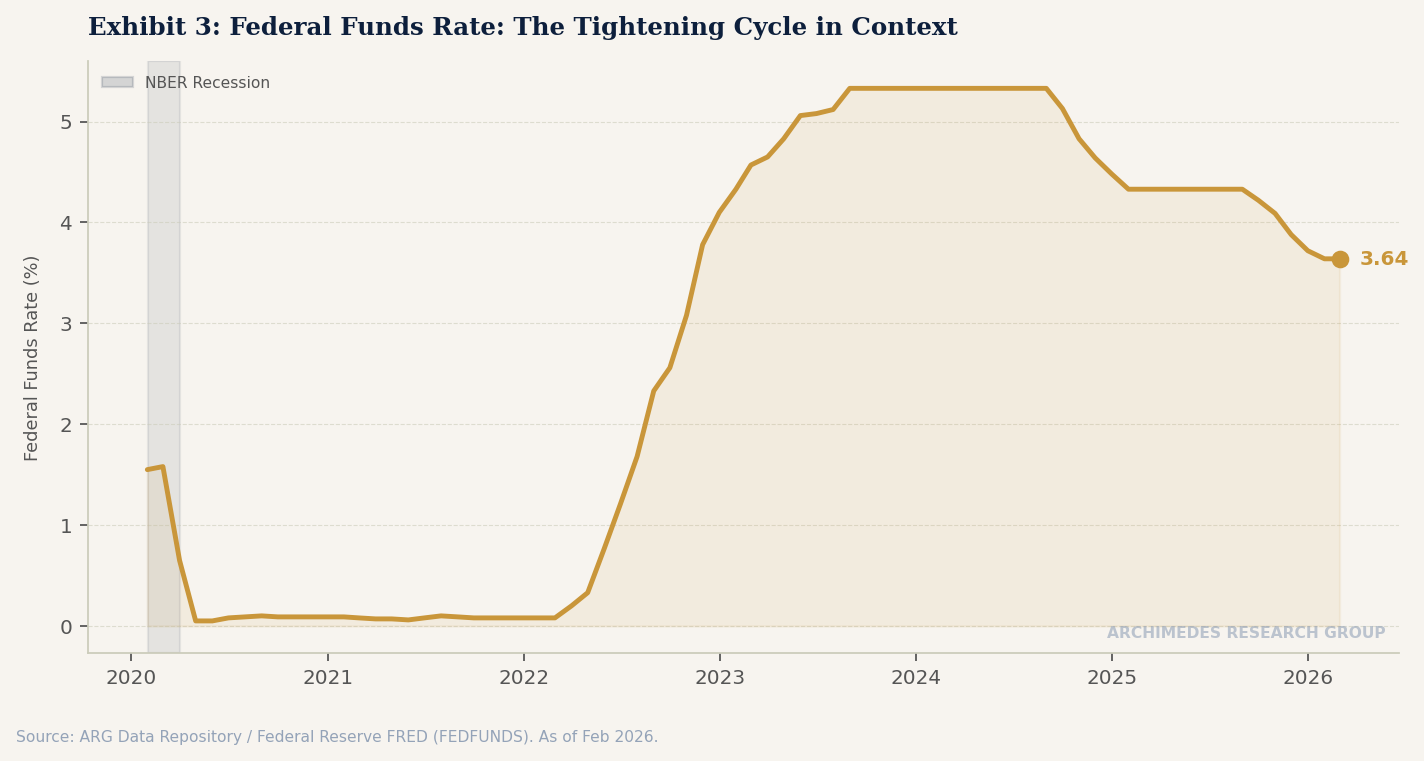
The Federal Reserve is expected to hold rates steady through most of 2026, with a potential cut not arriving until December at the earliest. That means the economy must absorb the tariff drag without meaningful monetary policy support. If the JOLTS data continues to deteriorate and initial claims push higher, the calculus changes — but by then, the recession signal may already be in the data.
One year after Liberation Day, the lesson from the indicators is clear: trade policy is not free. The costs show up in the CPI, in the trade data, in the JOLTS numbers, and eventually in the GDP print. Whether the long-term strategic benefits of reshoring and trade rebalancing justify those costs remains an open question — but so far, the data says we are paying the price without yet collecting the dividend.