Introduction
For the better part of a year, the American consumer has served as the last load-bearing wall of the U.S. expansion. Consumer spending accounts for roughly 68 percent of GDP, and even as manufacturing stumbled, trade deficits ballooned, and policy uncertainty froze business investment, household consumption kept the economy out of outright contraction. That resilience is now being tested from three directions simultaneously — and the cracks are starting to show.
Force One: The Tariff Tax That Never Left
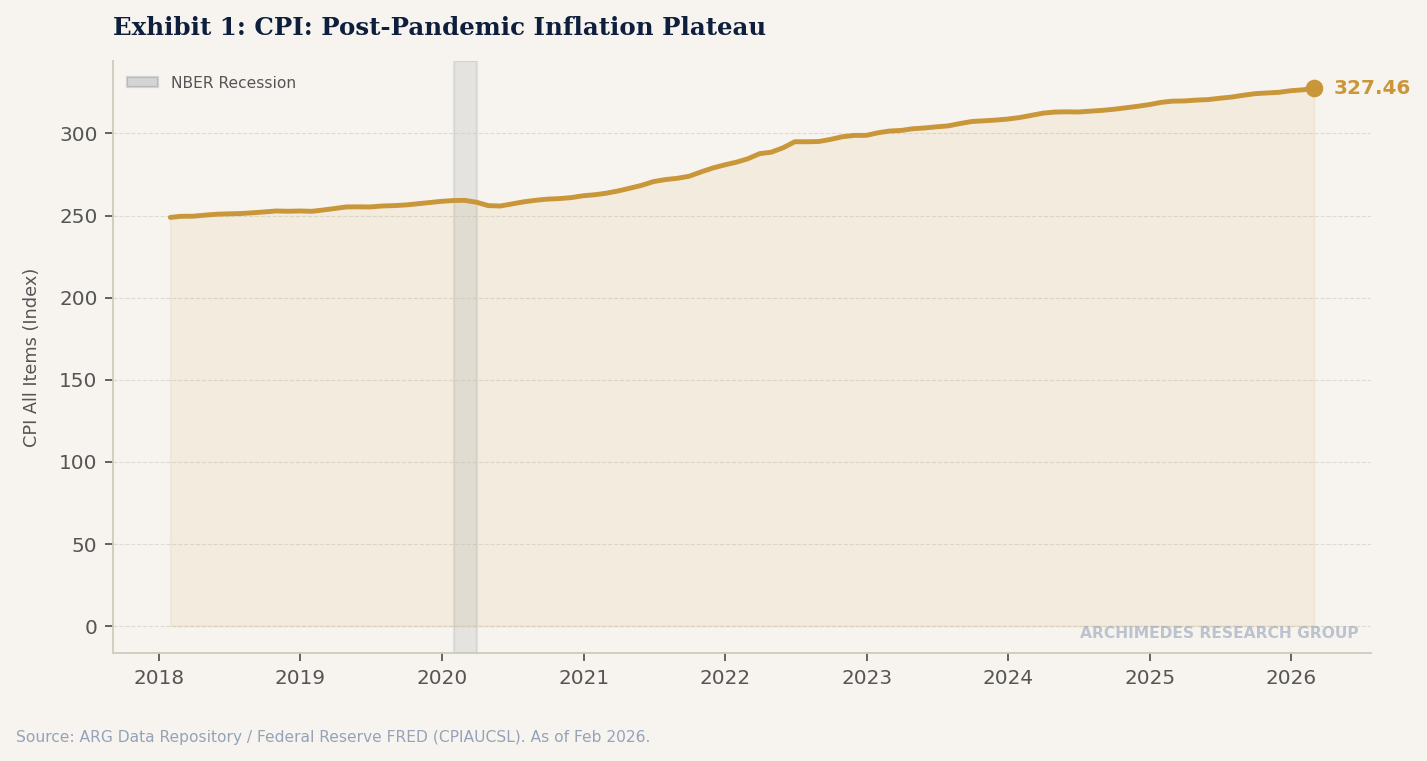
Yesterday marked one year since "Liberation Day" — the most sweeping tariff action in nearly a century. The subsequent twelve months brought Supreme Court challenges, partial rollbacks, bilateral deals, and more than fifty distinct policy changes. But the net burden on consumers has proven remarkably durable. The Yale Budget Lab estimates the current effective tariff rate at approximately 17.5 percent, still five times pre-2025 levels, imposing an annual cost of roughly $1,700 per American household in higher prices.
The pain is distributed unevenly. Apparel prices surged as much as 21 percent in the first year under the new tariff regime. Food prices climbed 2.8 percent from tariff effects alone, with sugar and sweets up nearly 6 percent year-on-year. Fed Chair Jerome Powell has attributed between half a percentage point and three-quarters of a point of current inflation directly to tariff pass-through. Research from the New York Fed found that Americans bore 94 percent of the tariff cost — the "foreign countries are paying" narrative simply never materialized in the data.
Perhaps more damaging than the price increases themselves has been the uncertainty. With the tariff regime changing more than fifty times in twelve months, businesses have struggled to plan, and that hesitation has bled into the labor market. Manufacturing — the sector tariffs were supposed to revitalize — shed roughly 100,000 jobs between January 2025 and early 2026. The ratio of manufacturing workers to total nonfarm employment fell to its lowest point since the Bureau of Labor Statistics began tracking the data in 1939.
Force Two: The Energy Shock
If tariffs were a slow-burn tax on consumption, the Iran conflict has been a sudden one. Since hostilities escalated in early March, Brent crude has surged to above $111 per barrel — up more than $41 from a year ago. West Texas Intermediate settled at $111.54 on April 2, its highest close since June 2022. Diesel has reached $5.45 a gallon, up 45 percent since the start of the conflict. The national average retail gasoline price has crossed $4.00 per gallon for the first time since the aftermath of Russia's invasion of Ukraine.
The mechanics are straightforward but severe. Iran's strategy of targeting shipping in the Strait of Hormuz — through which roughly a fifth of global crude supply transits — has introduced a persistent geopolitical risk premium into energy markets. Traders are now demanding about $14 more per barrel than pre-conflict levels simply to compensate for supply disruption risk. Even if a diplomatic off-ramp materializes in the near term, analysts at Goldman Sachs and Oxford Economics have noted that elevated insurance costs, freight premiums, and strategic stockpiling demand will keep prices supported well above pre-war levels.
For the consumer, energy is a uniquely regressive tax. Lower-income households spend a disproportionate share of their income on gasoline and utilities, and the pass-through is immediate — unlike tariff costs, which filter through supply chains over months, a $40 increase in crude reaches the pump within weeks. The Energy Information Administration's models suggest that the current crude price environment could push retail gasoline another 60 to 70 cents per gallon above seasonal norms, adding roughly $900 to $1,100 per year in fuel costs for the average two-car household.
Force Three: The Balance Sheet Is Fraying
The consumer might absorb one of these shocks. Perhaps even two. But the third force — the quiet deterioration of household balance sheets — is what makes the current convergence genuinely worrying.
The New York Fed's Q4 2025 Household Debt and Credit Report showed total household debt rising to $18.8 trillion, with credit card balances climbing $44 billion in the quarter to $1.28 trillion. More concerning than the headline balances are the delinquency dynamics underneath. Aggregate delinquency worsened to 4.8 percent of outstanding debt — up from 4.5 percent in Q3 and 1.2 percentage points higher than year-end 2024. Transitions into serious delinquency (90+ days past due) ticked up for credit cards, mortgages, and student loans.
The credit card picture is particularly stark. Roughly 7.1 percent of credit card balances have transitioned into serious delinquency over the past year — a rate comparable to levels observed during the early stages of the Great Recession. Thirty-day-plus delinquencies have risen steadily since late 2025, crossing levels last seen before the pandemic-era stimulus. Auto loan accounts 60 or more days past due have reached 1.54 percent, marking the fifth consecutive year of increases.
"The consumer may not be in crisis yet, but the buffer is gone. When you are already running delinquency rates reminiscent of 2008 and then layer on a tariff tax and an energy shock, the margin for error is razor-thin."
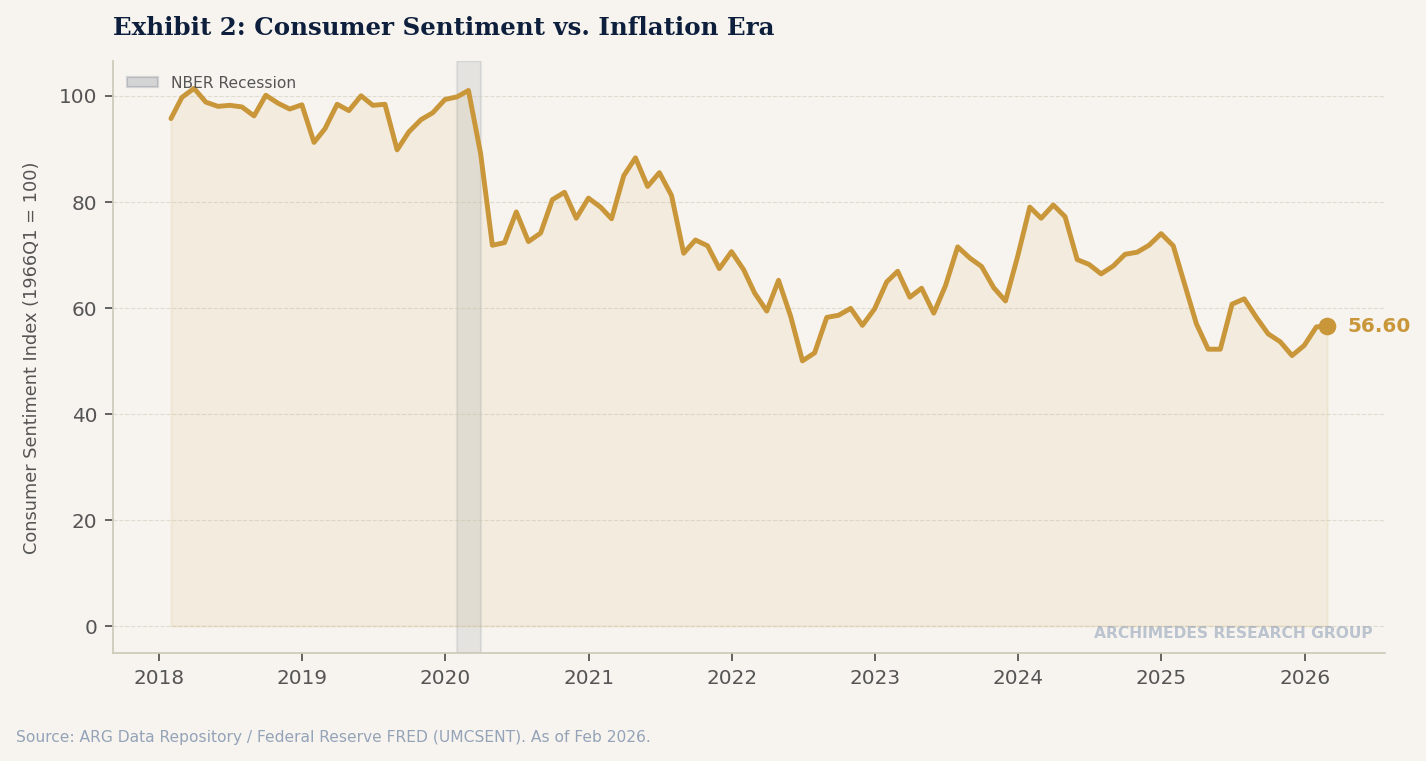
Meanwhile, consumer sentiment has deteriorated sharply. The University of Michigan Consumer Sentiment Index fell 6 percent in its most recent reading to its lowest level since December 2025, with declines broad-based across age groups, income levels, and political affiliations. Short-run economic expectations plunged 14 percent, and year-ahead expected personal finances sank 10 percent. Consumers with middle and higher incomes — those with stock market exposure — showed particularly steep declines as the S&P 500 entered correction territory in late March, dropping roughly 10 percent from its January peak.
What the Data Is Telling Us
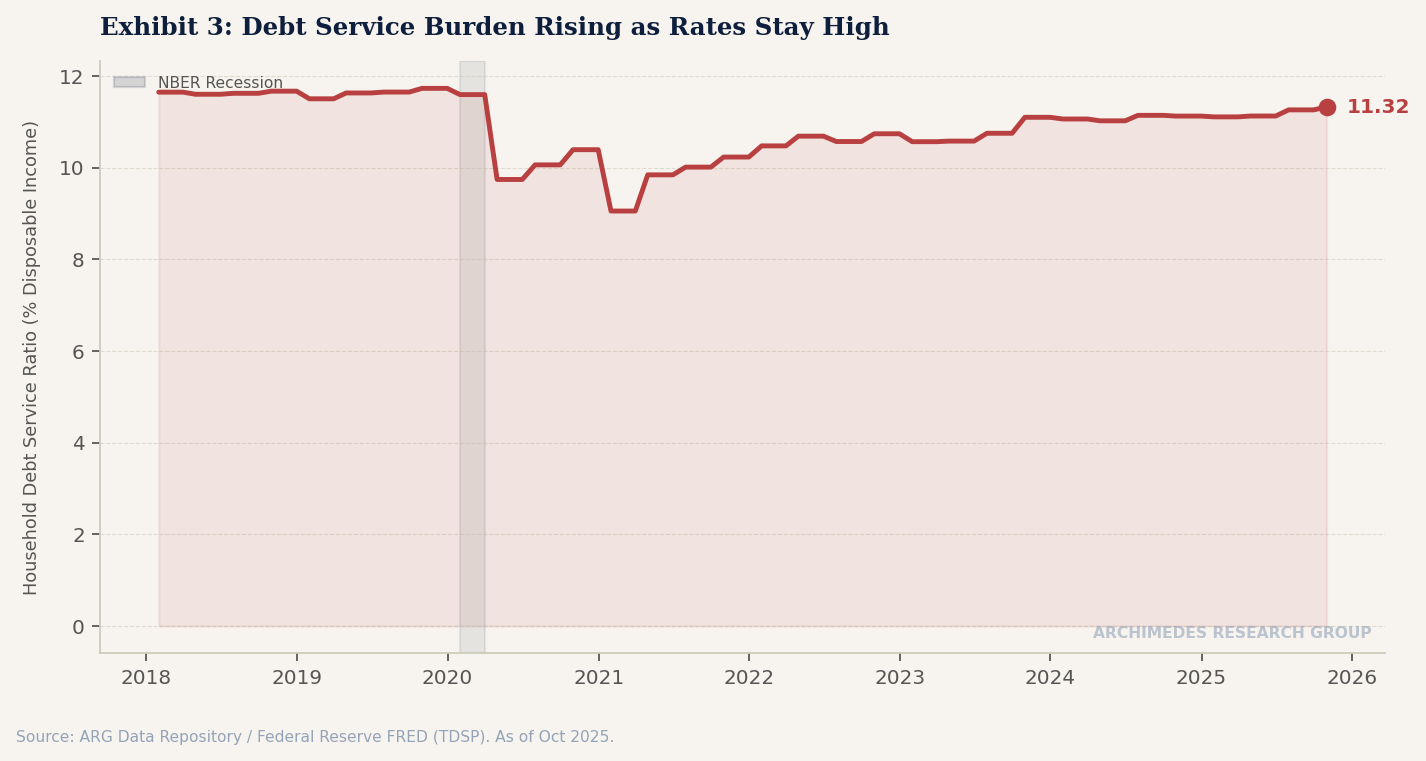
At Archimedes Research Group, we track over 80 macroeconomic series through our FRED-anchored data pipeline, and the convergence of these three forces shows up across multiple indicator domains simultaneously. The debt service ratio (TDSP), credit card delinquency rate (DRCCLACBS), consumer real estate delinquency rate (CORCCACBS), and consumer sentiment (UMCSENT) are all moving in the wrong direction at the same time — a pattern that, historically, has preceded meaningful slowdowns in personal consumption expenditure growth.
Financial conditions tell a more nuanced story. The Chicago Fed's National Financial Conditions Index (NFCI) and the St. Louis Fed's Financial Stress Index (STLFSI4) have tightened but have not yet reached levels associated with credit crunches. The Senior Loan Officer Opinion Survey (SLOOS) from late 2025 showed 12.5 percent of banks tightening commercial and industrial lending standards — up from 4.8 percent the prior quarter — citing economic uncertainty and reduced risk tolerance. The question is whether the consumer credit deterioration forces further tightening, creating a feedback loop between household stress and credit availability.
The Fed, for its part, is boxed in. The FOMC held rates at 3.50 to 3.75 percent at its March meeting, with projections pointing to only one additional cut in 2026. Tariff-driven goods inflation and energy price pressures make an aggressive cutting cycle politically and technically difficult, even as the consumer data screams for relief. It is the classic stagflationary bind: the tools to address slowing growth conflict with the tools to address persistent inflation.
The Road Ahead
None of this constitutes a recession call. The Sahm Rule indicator remains at 0.3 percent — well below its 0.5 percent trigger. The yield curve has normalized to a positive spread. Payrolls, while decelerating, are still growing. But the consumer — the engine that powered the economy through the tariff shock, through the hiring freeze, through the market correction — is running on fumes. When the buffer between resilience and vulnerability is measured in credit card balances rather than savings, the economy is one shock away from a very different conversation.
The next several months will be decisive. The March jobs report, due tomorrow, will offer the first read on whether the energy shock has begun to suppress hiring. The April JOLTS data will reveal whether the hiring freeze documented in our previous analysis has deepened. And the Q1 2026 GDP advance estimate, due in late April, will provide the most comprehensive accounting yet of how these three forces are interacting in the real economy.
For now, the American consumer is holding. But holding is not thriving — and the forces arrayed against household balance sheets are not receding. They are compounding.
Archimedes Research Group is an independent economic research and intelligence firm. This article is for informational purposes only and does not constitute investment advice. Data sources include the Federal Reserve Bank of St. Louis (FRED), Bureau of Labor Statistics (BLS), New York Federal Reserve Household Debt and Credit Report, Yale Budget Lab, Tax Foundation, University of Michigan Surveys of Consumers, and U.S. Energy Information Administration (EIA). All data referenced is publicly available as of the publication date.