The Signal
For fourteen consecutive years, the United States has held the top position in Kearney's annual FDI Confidence Index — the most widely cited barometer of where global executives intend to deploy capital. It still does. But the 2026 edition tells a more nuanced story than the headline ranking suggests.
Net investor optimism toward the U.S. dropped 17 points year-over-year. Canada, in second place for the fourth straight year, is closing the gap. And below them, the composition of the top 25 has undergone a quiet but decisive transformation: Asia-Pacific economies now occupy 10 of the 25 ranked slots, the region's strongest showing since the early 2010s. Japan has climbed to third. Singapore vaulted from 15th to 8th. South Korea, Thailand, and Malaysia all posted significant gains, with the latter two re-entering the top 25 entirely.
This is not cyclical rotation. It is structural repricing of where the world's largest companies believe durable returns will come from — and the forces driving it trace directly to U.S. trade policy uncertainty, the escalating competition in industrial policy, and a generational bet on technology-led growth in Asia.
Tariff Fatigue and the Cost of Uncertainty
The backdrop to this FDI shift is impossible to ignore. The U.S. effective tariff rate now stands at approximately 11% — the highest since 1943, according to the Yale Budget Lab. Following the Supreme Court's February 2026 ruling that struck down key elements of the 2025 tariff architecture, the administration pivoted to Section 122 of the Trade Act of 1974, imposing a blanket 15% tariff on all imports for up to 150 days. New Section 301 investigations targeting China, Vietnam, Taiwan, Mexico, Japan, and the EU signal that the trade policy environment will remain volatile well beyond the Section 122 expiration window in late July.
For multinational capital allocators, the issue is less the tariff rate itself than the regime uncertainty it creates. When the rules of cross-border commerce shift every quarter — and when judicial, legislative, and executive branches are actively contesting who sets trade policy — long-duration investment decisions become harder to underwrite. The 17-point drop in U.S. net optimism in the Kearney survey is a direct reflection of this dynamic: executives still see American market depth and innovation capacity, but they are hedging.
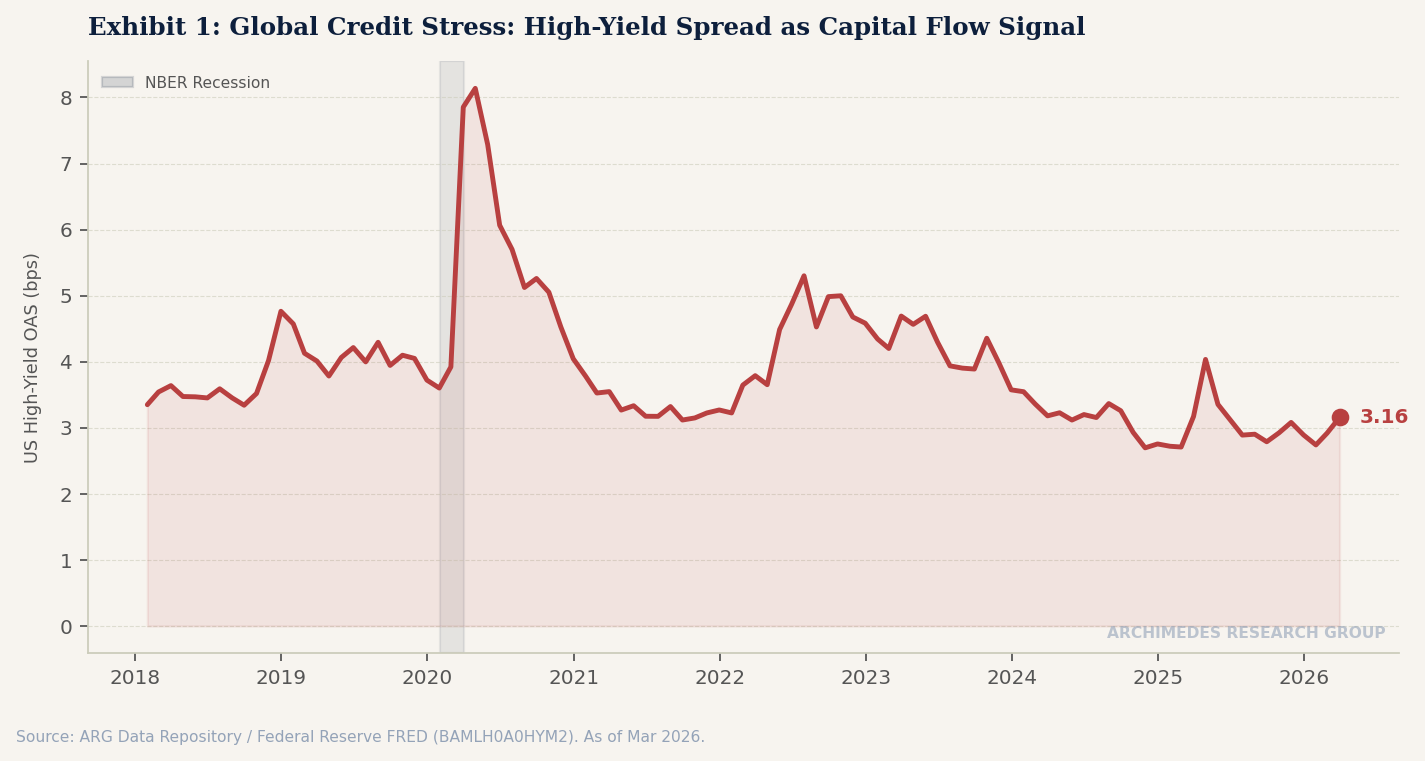
Our own macro data reinforces the caution. U.S. high-yield credit spreads (ICE BofA HY OAS) have widened from 2.74% in January to 3.19% in March — a move that signals tightening financial conditions for the corporate sector most exposed to trade disruption. The S&P 500 has retreated roughly 4% from its January peak, and the Chicago Fed's National Financial Conditions Index has shifted from -0.56 to -0.46 over the same period, confirming a modest but meaningful tightening impulse.
Asia's Industrial Policy Advantage
If tariff uncertainty is the push factor, Asia's industrial policy architecture is the pull. The Kearney survey found that 84% of executives now rate industrial policy as "extremely" or "very important" in their investment decisions — a striking figure that reflects how much the competitive landscape has shifted from pure market fundamentals to state-enabled ecosystem design.
Singapore's leap to 8th place is the clearest case study. Thirty-four percent of investors cited technological innovation as the primary reason to invest there — not labor cost, not market size, but the deliberate construction of an R&D and innovation hub through tax incentives, research grants, and public-private partnerships. Singapore's strategy is not to compete on factor costs with its neighbors but to position itself as the capital allocation node for Southeast Asia's $4 trillion economy.
Japan's rise to third — its highest ranking in years — follows a similar logic. Tokyo's semiconductor investment incentives (including the TSMC and Rapidus fabrication projects), combined with a weaker yen that makes Japanese assets relatively inexpensive in dollar terms, have created a compelling value proposition for technology-oriented FDI. Japan is also benefiting from the "China+1" diversification wave: companies that once concentrated production in China are splitting capacity, and Japan's industrial base, skilled workforce, and rule-of-law stability make it a natural alternative for higher-value manufacturing.
Thailand and Malaysia's return to the top 25, meanwhile, reflects the downstream effects of supply chain reorganization. As multinationals restructure sourcing away from China — driven by tariff exposure, geopolitical risk, and ESG considerations — ASEAN's manufacturing belt is absorbing the redirected flows. Thailand's automotive and electronics sectors and Malaysia's semiconductor packaging industry are direct beneficiaries.
What the Data Tells Us
The FDI confidence data aligns with what we observe in the macro indicators tracked by ARG's economic pipeline. The U.S. 10-year Treasury yield has risen to 4.32% in early April, while the 2-year sits at 3.80%, producing a yield curve spread (10Y-3M) of approximately 0.63% — still positive, but reflecting expectations of policy rate stickiness and term premium expansion. The Fed funds rate remains at 3.64%, and with trade-driven inflationary impulses clouding the outlook, the path to further easing has narrowed considerably.
This matters for FDI because the cost of capital is a foundational input in cross-border investment decisions. When U.S. rates are sticky-high and policy uncertainty is elevated, the relative attractiveness of deploying capital in economies with lower policy volatility — Singapore, Japan, the UAE — increases mechanically. The 88% of executives who told Kearney they plan to increase FDI over the next three years are not retreating from globalization; they are rebalancing it.
Implications
The 2026 FDI Confidence Index is not a forecast — it is a revealed preference survey of where the world's largest companies intend to put money. Three implications stand out for investors, policymakers, and corporate strategists:
First, the U.S. tariff regime is generating measurable capital diversion. The softening in U.S. FDI sentiment, combined with Asia-Pacific's historic gains, suggests that trade policy uncertainty has crossed the threshold where it affects real allocation decisions — not just rhetoric. Companies are not leaving the U.S. market, but marginal dollars are being redirected.
Second, industrial policy is now a competitive asset class. The 84% figure on industrial policy importance is a structural shift. Governments that can credibly offer long-duration incentive frameworks — not one-off tax breaks, but integrated ecosystems of R&D support, workforce development, and regulatory predictability — will capture a disproportionate share of technology-oriented FDI.
Third, the "China+1" trade is broadening into "Asia+Everywhere." What began as a narrow supply chain diversification strategy away from China has evolved into a broader reassessment of where value chains should be anchored. The beneficiaries are not limited to ASEAN — Japan, South Korea, India, and the Gulf states are all drawing capital. The emerging geography of global production is more distributed, more hedged, and less centered on any single economy than at any point since the early 2000s.
Watch List
Section 122 expiration (late July 2026): The 150-day tariff window is a hard deadline. Whether it is extended, replaced, or allowed to lapse will be the single most consequential U.S. trade policy event of the year.
Section 301 investigation timelines: New probes into China, Vietnam, Taiwan, and the EU could produce targeted tariff actions by Q4 2026, adding another layer of uncertainty for cross-border investment planning.
U.S. high-yield spreads: If HY OAS continues widening beyond 3.5%, it would signal that tariff-related stress is migrating from sentiment into credit fundamentals — a more serious transmission channel.
Singapore and Japan FDI inflow data (Q2 2026): The Kearney index measures intent. Actual UNCTAD and national statistics on realized FDI flows will confirm or challenge whether the survey signal is converting into capital deployment.
Fed policy path: With the funds rate at 3.64% and inflation expectations muddied by trade policy, the June and September FOMC meetings will clarify whether rate relief is coming — or whether sticky monetary conditions will amplify the FDI rebalancing toward lower-cost-of-capital jurisdictions.