The Signal
The Federal Reserve has delivered 186 basis points of rate cuts since the fed funds target peaked at 5.50% in mid-2024. By almost any historical benchmark, that is a significant easing cycle — enough to shift borrowing costs, stimulate credit demand, and pull inflation toward target. And yet, as of March 2026, headline CPI stands at 3.29% year-over-year. Core CPI sits at 2.60%. Neither is close to 2%.
The explanation is not energy. It is not goods. It is not services broadly. The explanation is shelter.
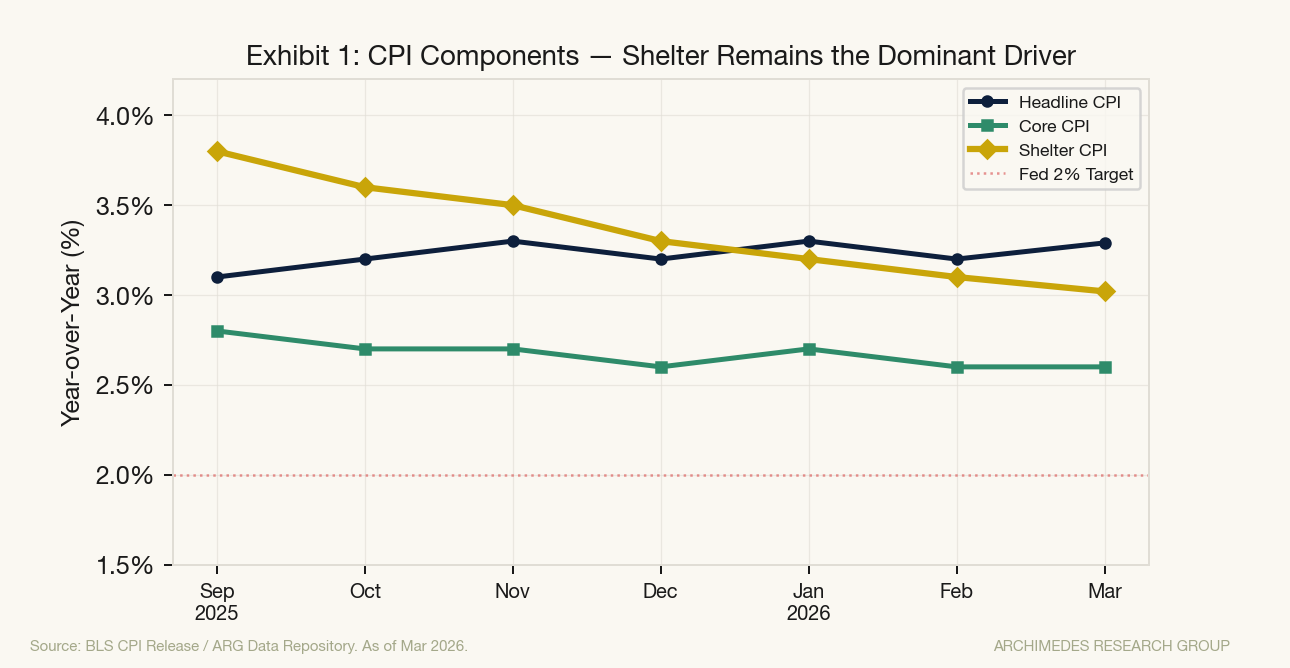
Shelter inflation — tracked by the Bureau of Labor Statistics as CUSR0000SAH1, encompassing primary rent and owners' equivalent rent — registered 3.02% year-over-year in March 2026. The March reading annualizes at 3.2%, with monthly gains of 0.23% in February and 0.27% in March. Shelter represents approximately 36% of the headline CPI basket, meaning it alone contributes over 1.09 percentage points to the current 3.29% inflation rate.
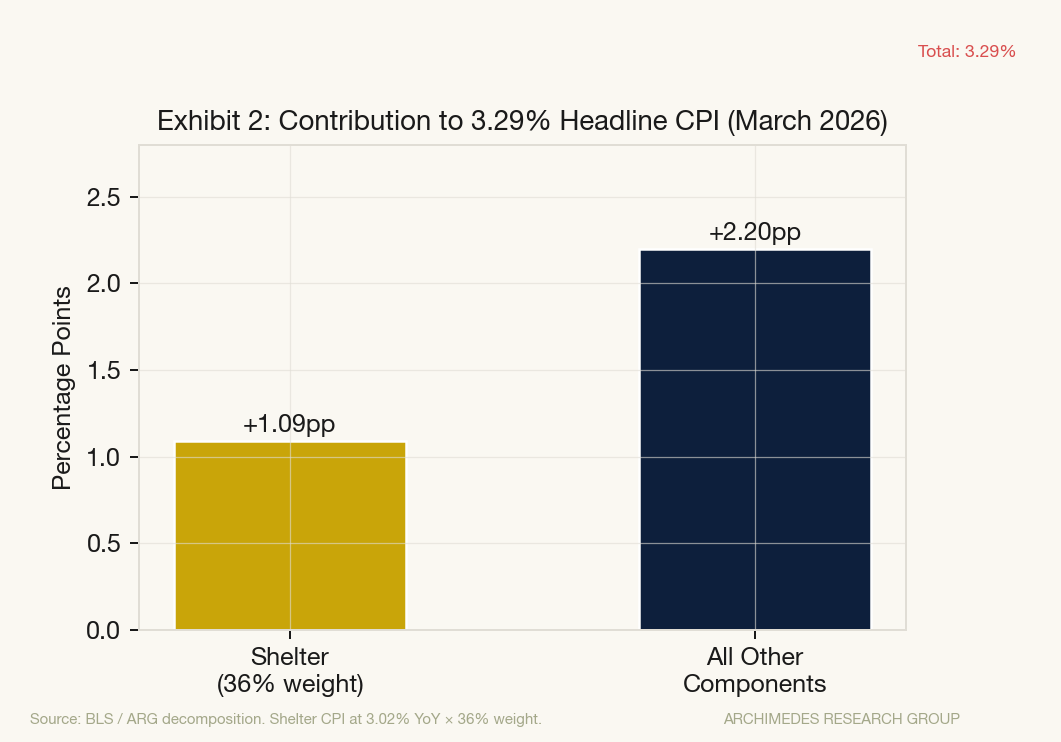 If shelter ran at the Fed's 2% target rather than 3.0%, headline CPI would be approximately 2.9% — still above target, but materially closer to it.
The Fed has not failed to ease. It has eased into a wall that monetary policy cannot directly dismantle.
The Mechanism
The dynamics sustaining shelter inflation are structural, not cyclical. Three forces are operating simultaneously, and each reinforces the others.
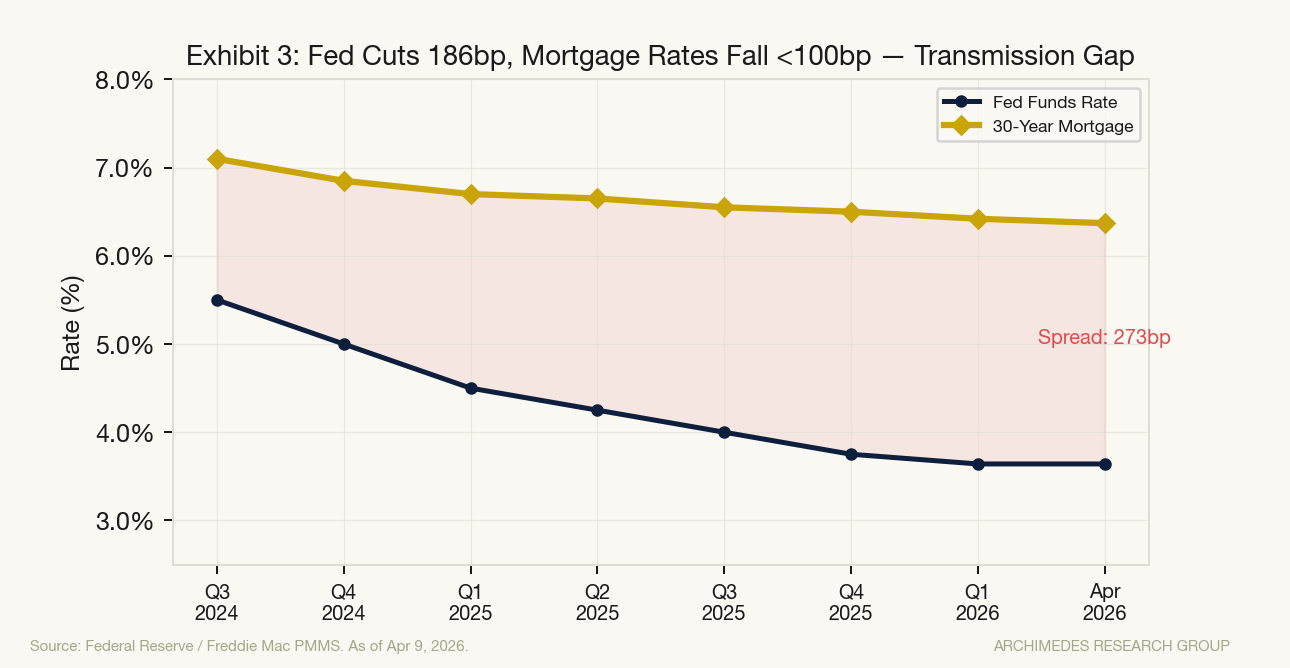
The first is the lock-in effect. Approximately 85% of outstanding U.S. mortgages carry interest rates below 5%, the majority originated during the 2020–2022 period when 30-year fixed rates hovered between 2.65% and 3.25%. With the current 30-year fixed rate at 6.37% as of April 9, 2026, a homeowner refinancing or trading up faces a payment increase of roughly 60–70% on a comparably priced home. The rational response is inaction. Supply of existing homes for sale has therefore remained deeply constrained, compressing household mobility and sustaining rental demand in markets where ownership remains out of reach.
The second force is the mortgage spread. The Federal Reserve controls the short end of the curve; it does not control the 30-year mortgage rate directly. Mortgage rates track the 10-year Treasury yield with a historical spread of approximately 150–180 basis points. Today, the 10-year Treasury sits at 4.29%, and the 30-year fixed is 6.37% — a spread of 208 basis points, above the historical norm. The mortgage-to-fed-funds spread is wider still at 273 basis points, as the term premium has been elevated by persistent inflation uncertainty and tariff-driven fiscal risk. The Fed cut 186 basis points; the 30-year mortgage declined by less than 100 basis points from its peak. The transmission is attenuated.
The third is measurement methodology. OER and primary rent, together the largest components of shelter CPI, are constructed from survey data capturing lease renewals and existing tenants — not new market-rate contracts. Real-time rent indices showed significant disinflation beginning in late 2023, with national asking-rent growth turning slightly negative through much of 2024. But the BLS measure lags real-time market signals by 12 to 18 months, as existing leases roll over gradually. That disinflation is feeding into CPI data only now, and its full impact will not be reflected until late 2026 or early 2027.
The Composition
Within the shelter component, the critical dynamic is the divide between what is happening in lease renewals versus new lease originations. New supply has increased modestly — housing starts reached 1,487,000 annualized units in January 2026, up from a trough of 1,272,000 in October 2025. Multifamily completions have remained elevated, providing incremental relief in Sun Belt and select gateway markets. But this supply is arriving unevenly, and in much of the country, the rental market remains structurally tight.
The gap between core CPI and shelter reveals the underlying dynamic precisely. Core CPI at 2.60% includes a shelter reading of 3.02%. The remainder of core — goods, non-shelter services — is running below 2.5%. Strip shelter from the basket, and the rest of the inflation picture is largely consistent with the Fed's mandate. Shelter is not one problem among many; it is the problem. And unlike demand-driven inflation — which rate hikes suppress by cooling activity — shelter inflation is being sustained primarily by supply mechanics that rate cuts cannot fully address.
Counterarguments and Limits
The case for rapid shelter disinflation is real and deserves direct treatment. New lease data, which leads the BLS shelter measure, has already softened substantially. Apartment List's national rent index has been in near-flat territory for several quarters. If BLS methodology imports this signal at the expected lag, shelter CPI could decelerate meaningfully into the second half of 2026, potentially falling to 2.0–2.5% by year-end. That outcome would bring core CPI very close to the Fed's target without additional policy action.
There is also the supply argument. Multifamily completions running above long-run averages, combined with moderation in household formation, is producing a supply-demand balance less stressed than at any point since 2020. In some metros — notably Austin, Phoenix, and Charlotte — effective rents have declined year-over-year. If this regional softening broadens, the national OER reading will follow.
The limits of this thesis are worth acknowledging explicitly. The shelter inflation story is partly mechanical: if the BLS lag simply catches up to market data, disinflation is arithmetically assured. The uncertainty lies in timing and in whether new inflationary pressures — tariff pass-through to household goods, services re-acceleration, energy costs — emerge to fill the gap as shelter cools. An inflation composition shift, rather than a level shift, is entirely plausible.
What Would Change the View
Mortgage Rates Fall Below 6.0% and Hold: If 30-year fixed rates declined and remained below 6.0% for a sustained period, the lock-in effect would begin to ease, increasing inventory and household mobility. This would require either a significant decline in the 10-year Treasury yield or a compression of the mortgage-Treasury spread toward historical norms. Under this scenario, shelter disinflation would accelerate and core CPI could reach 2.0% by mid-2026.
Housing Starts Sustained Above 1.5 Million: A durable trend in starts above 1.5 million annualized — particularly in multifamily — would add supply to the markets where rental pressure is most acute. The January 2026 print of 1,487,000 is close but has not yet demonstrated the sustained trend required to move the needle on national OER. Confirmation over two to three consecutive months would materially shift the supply outlook.
Real-Time Rent Indices Re-Accelerate: If new-lease rent growth turns positive and durable — driven by household formation, immigration-linked demand, or tariff-induced location constraints — the expected BLS disinflation would be partially offset by incoming fresh price pressure. This scenario would extend the Fed's last mile from late 2026 into 2027 or beyond, forcing a reassessment of the rate path.
Conclusion
The Federal Reserve has done the work. 186 basis points of cuts represent a genuine and substantial monetary easing that has passed through to credit markets, financial conditions, and the real economy. What it has not done is resolve the housing supply problem at the root of persistent shelter inflation. At 3.02% year-over-year, shelter is not a rounding error; it is the dominant variable in the inflation outlook. ARG's view is that shelter disinflation will continue flowing through the BLS measurement apparatus into the second half of 2026, with core CPI likely approaching 2.0–2.2% by year-end — but the pace of that convergence depends critically on whether mortgage rates decline enough to unlock supply. At 6.37%, they have not yet crossed that threshold.
Data: Federal Reserve FRED — CPIAUCSL, CPILFESL, CUSR0000SAH1, FEDFUNDS, MORTGAGE30US, DGS10, HOUST. All figures as of most recent available period, March–April 2026.